The DESI Legacy Imaging Surveys are producing an inference model of the 14,000 square degrees of extragalactic sky visible from the northern hemisphere in three optical bands (\(g,r,z\)) and four infrared bands. The sky coverage is approximately bounded by -18° < δ < +84° in celestial coordinates and \(|b|\) > 18° in Galactic coordinates. To achieve this goal, the Legacy Surveys are conducting 3 imaging projects on different telescopes, described in more depth at the following links:
The Beijing-Arizona Sky Survey (BASS) |
The DECam Legacy Survey (DECaLS) |
The Mayall z-band Legacy Survey (MzLS) |
An overview of the surveys is available in Dey et al. (2019).
Contents of DR9
Data Release 9 (DR9) is the ninth public data release of the Legacy Surveys. It is the seventh public data release of images and catalogs from DECaLS (DR8 comprised the sixth release of data from DECaLS) and the fourth release of data from BASS and MzLS (DR8 comprised the third release of data from BASS and MzLS). DR8 was the first release to include images and catalogs from all three of the Legacy Surveys in a single release, and essentially provided the final, full sky coverage of Legacy Surveys imaging. DR9 does not contain significant new observations, but builds on DR8 by improving the reduction techniques and procedures used for the Legacy Surveys. Imaging from the Legacy Surveys is first reduced through the NOIRLab Community Pipeline before being processed using the Tractor. DR9 also includes WISE fluxes from all imaging through year 6 of NEOWISE-Reactivation force-photometered in the unWISE maps at the locations of Legacy Surveys optical sources.
DR9 includes BASS (\(g,r\)-band) images taken from 12th November 2015 through 7th March 2019 and MzLS (\(z\)-band) images taken from 19th November 2015 through 12th February 2018. Images from DECaLS \(g,r,z\)-band observations (survey program 0404) are included from 9th August 2014 through 7th March 2019. DR9 also includes DECam data from a range of non-DECaLS surveys, including observations that were conducted from 31st August 2013 to 7th March 2019. A large portion of these non-DECaLS observations were taken by the Dark Energy Survey. Information on the exact observations included in DR9 can be derived from the Legacy Surveys survey-ccds-* files.
The table below indicates the area covered in DR9 for different numbers of passes and in different filters across the entire unique survey area. Unique area in this table is resolved by including all DECam images (the majority of which are from DECaLS) but only including BASS and MzLS images if they are both at Declination > 32.375° and north of the Galactic Plane. These are area estimates derived from the geometry of the CCDs that contribute to the Legacy Surveys footprint, using the random catalogs at a density of 45,000 deg-2.
Band/Number of Passes |
≥ 1 |
≥ 2 |
≥ 3 |
|---|---|---|---|
\(g\)-band |
19,919 deg2 |
19,256 deg2 |
16,606 deg2 |
\(r\)-band |
19,915 deg2 |
19,177 deg2 |
16,333 deg2 |
\(z\)-band |
20,242 deg2 |
19,420 deg2 |
16,972 deg2 |
All bands jointly |
19,721 deg2 |
18,813 deg2 |
14,756 deg2 |
South of Declination -18° the Legacy Surveys imaging is dominated by observations from the Dark Energy Survey. North of -18°, the area covered in DR9 for different numbers of passes and in different filters is:
Band/Number of Passes |
≥ 1 |
≥ 2 |
≥ 3 |
|---|---|---|---|
\(g\)-band |
15,723 deg2 |
15,194 deg2 |
12,605 deg2 |
\(r\)-band |
15,712 deg2 |
15,124 deg2 |
12,346 deg2 |
\(z\)-band |
15,876 deg2 |
15,275 deg2 |
12,939 deg2 |
All bands jointly |
15,566 deg2 |
14,784 deg2 |
10,802 deg2 |
DR9 includes a variety of pixel-level and catalog-level products, which are described in more detail on the files page. The size of the DR9 data distribution, split out into contributions from the north (BASS/MzLS) and south (DECaLS) to match the directory structure of DR9 is:
Size* |
Directory |
Description |
|---|---|---|
1.9 TB |
Calibration files |
|
1.5 KB |
Link to webgpages of notable images (e.g. NGC galaxies) |
|
6.6 GB |
Files containing external catalogs used for masking |
|
23 TB + 66 TB |
Coadded images (image stacks) |
|
18 GB + 18 GB |
Matches to other catalogs (SDSS, etc.) |
|
362 GB + 2.8 TB |
Brick-organized forced-photometry catalogs |
|
788 GB + 5.7 TB |
Exposure-organized forced-photometry catalogs |
|
12 GB + 47 GB |
Log files generated by Tractor processing |
|
1.1 TB + 2.7 TB |
Metrics and statisics of Tractor fits |
|
91 GB + 616 GB |
CCD-level masks of outlier pixels (cosmic rays, satellite trails, etc) from image differencing |
|
536 GB |
Catalogs of random points |
|
77 GB + 208 GB |
Region-specific catalogs of random points |
|
720 GB + 3.2 TB |
Subsets of the Tractor catalogs and row-by-row matched products |
|
741 GB + 3.3 TB |
The Tractor catalogs |
|
784 GB + 3.4 TB |
Expanded versions of the Tractor catalogs |
*Note that although the contents of a directory should be fixed for each Data Release, the size of a directory can change. This is typically due to updated file compression. So, the listed directory sizes should be viewed as (very reasonable) estimates.
For all of the DESI Legacy Imaging Surveys, coadded images and Tractor catalogs are presented in "bricks" of approximate size 0.25° × 0.25°. Each brick is defined in terms of a box in RA,Dec coordinates. The image stacks use a simple tangent-plane (WCS TAN) projection around the brick center. The projections for the \(g,r,z\) filters are identical, with a pixel scale of 0.262″/pix. The projections for the four WISE filters are also identical but with a pixel scale of 2.75″/pix. There are 662,174 bricks spread over the sky, meaning that each brick has an average area of 0.0623 deg2. The brick images have some overlap.
There are approximately 2.0 billion unique sources in DR9 spread over 331,958 unique bricks.
Obtaining Images and Raw Data
Images for all 3 of the Legacy Surveys can be viewed directly using the Sky viewer
and raw data can be obtained through the NOIRLab portal (see also the information near
the bottom of the files page). Note that the weight map images (the oow files) that can be retrieved either from the viewer or
portal are in the same units as \(1/\mathtt{skyrms}^2\) in the survey-ccds-<camera>-dr9.fits.gz files. But, these images need
to be multiplied by both gain and exptime to retrieve units of electrons (for <camera> of mosaic or 90prime).
Sections of the Legacy Surveys for DR9 can be obtained as JPEGs or FITS files using the cutout service, for example, as follows:
JPEG: https://www.legacysurvey.org/viewer/jpeg-cutout?ra=190.1086&dec=1.2005&layer=ls-dr9&pixscale=0.262
This will merge the northern (MzLS+BASS) and southern (DECam) images at a line corresponding to Dec=32.375°.
To request images from only the northern or southern surveys, specify dr9-north or dr9-south, for example:
JPEG (DECaLS): https://www.legacysurvey.org/viewer/jpeg-cutout?ra=190.1086&dec=1.2005&layer=ls-dr9-south&pixscale=0.262
FITS (DECaLS): https://www.legacysurvey.org/viewer/fits-cutout?ra=190.1086&dec=1.2005&layer=ls-dr9-south&pixscale=0.262&bands=grz
JPEG (BASS/MzLS): https://www.legacysurvey.org/viewer/jpeg-cutout?ra=154.7709&dec=46.4537&layer=ls-dr9-north&pixscale=0.262
FITS (BASS/MzLS): https://www.legacysurvey.org/viewer/fits-cutout?ra=154.7709&dec=46.4537&layer=ls-dr9-north&pixscale=0.262&bands=grz
where "bands" is a string such as "\(grz\)","\(gz\)","\(g\)", etc.
Replacing layer=ls-dr9 (or, e.g., layer=ls-dr9-north) with layer=ls-dr9-model (layer=ls-dr9-north-model) or layer=ls-dr9-resid (layer=ls-dr9-north-resid) will instead return cutouts for the model and residual images, respectively.
The size of the image can also be specified using \(width\), \(height\) and \(size\), where \(size\) forces \(width\) and \(height\) to be equal. For example:
It is possible to retrieve multiple cutouts from the command line using standard utilites such as wget.
The maximum size for cutouts (in number of pixels) is currently 512. Pixscale=0.262 will return (approximately) the native pixels used by the Tractor.
More examples are available on the list of URL/cutout patterns that are supported by the viewer.
Source Detection
The source detection uses a PSF- and SED-matched-filter detection on the stacked images, with a 6σ detection limit. The Tractor fitting step is initialized with these positions, although these positions can be changed during the fits and low-S/N sources can be removed.
For source detection, each image is convolved by its PSF model, then a weighted stack of these is created in order to optimize the point-source detection efficiency. Next, SED-matched combinations of the three bands are created, for two SEDs: "flat" (a source with AB color zero), and "red", a source with AB color \(g-r = 1\), \(r-z = 1\). Sources above 6σ are detected in each of these two SED-matched filters, as well as independently in each band.
The locations of the peak fluxes of extracted sources are used to determine where objects are photometered and how the initial parameters for an object are seeded. When a source is detected in multiple bands a choice of filter must be made to seed the initial extraction. Sources detected in other bands beyond the initial filter are only kept if they are sufficiently separated from an object that was extracted in previous bands. In DR4, DR3 and earlier data releases, source detection was run first in \(g\), then in \(r\), \(z\), "flat" and finally in "red". Starting with DR5, source detection was run first in \(z\), then in \(r\), \(g\), "flat" and finally in "red". \(z\) was chosen as the "primary" detection image to take advantage of the better PSF in that band.
Starting with DR7 the criteria for deciding whether a flux peak is a distinct source were relaxed. The minimum possible distance between neighboring peaks was reduced from 6 pixels (about 1.5 arcseconds) to 4 pixels (about 1 arcsecond). In addition, the "saddle" depth (dip in flux) necessary to model neighboring peaks as distinct sources was reduced.
Starting with DR8, many different "foreground" objects are extracted as independent sources in a similar fashion to how Gaia stars were extracted in DR7. These include bright stars, medium-bright stars, globular clusters and SGA (Siena Galaxy Atlas) large galaxies (as detailed on the external catalogs page). The foreground objects consist of pre-defined geometrical masks (which are elliptical for galaxies) that are fixed at their expected positions in the Legacy Surveys images after accounting for proper motion and parallax in Gaia Data Release 2. The reasoning behind treating bright foreground sources as special cases is that many of them have large halos or include diffuse light that is not included in the Tractor model choices. This leads such sources to be typically best fit by misleading (and computationally expensive) diffuse galaxy models.
Sources that are within a mask region have MASKBITS
set (see the bitmasks page). Within the mask regions for bright stars (BRIGHT), globular clusters (CLUSTER)
and SGA large galaxies (GALAXY), sources are forced to be TYPE=PSF
(except for the SGA large galaxies themselves). Note that sources are not forced to be TYPE=PSF in the region of medium-bright stars
(i.e. if MEDIUM is set but BRIGHT, CLUSTER, and GALAXY are not).
Mask regions are ignored in the Tractor local-sky-fitting calibration code and are superseded by fits within the mask regions themselves.
Within BRIGHT, MEDIUM and GALAXY mask regions (except for the SGA large galaxies themselves), a per-source background sky level is fit in the mask blob for each exposure.
Starting with DR9, objects that appear in the Gaia catalogs are always retained in the Tractor catalogs, even if they would normally be cut by the
model-selection criteria used to detect sources. This is because Gaia sources are often so bright that they saturate in Legacy Surveys imaging.
Since such "retained" Gaia sources have no model fits, their flux_g, flux_r and flux_z values are estimated in the catalogs,
using polynomial fits to Gaia-to-DECam color transformations for stars.
Transformations to DECam are used even in areas of the Legacy Surveys footprint that are only covered by BASS and MzLS.
The flux_ivar_[grz] values for these "retained" Gaia sources are set to zero.
PSF
The Tractor makes use of the PSF on each individual exposure. The PSF for
the individual exposures are first computed independently for each CCD
using PSFEx, generating spatially varying pixelized models. Note that it is possible that
survey-* and *-annotated-* files could record information
that is missing from other files in cases where PSFEx fails. This is expected behavior.
Starting with DR9, a modified, extended PSF model is used to subtract the extended wings of bright stars from DECam images.
The configuration files for SExtractor and PSFEx that were used for a given
iteration of the Legacy Surveys legacypipe codebase are available on our GitHub page.
Sky Level
The Community Pipeline removes a sky level that includes a sky pattern, an illumination correction, and a single, scaled fringe pattern. These steps are described on the NOIRLab Community Pipeline page. These corrections are intended to make the sky level in the processed images near zero, and to remove most pattern artifacts. A constant sky level, that is the mean of what was removed, is then added back to the image.
Additionally, a spatially varying (spline) sky model is computed and removed, by detecting and masking sources, then computing medians in sliding 512-pixel boxes. The image stacks provided on the files page have this sky level removed. As noted under Source Detection, above, any regions (blobs) covered by foreground sources are specially treated.
Changes in the Community Pipeline after DR8 (in particular the switch to using star flats from the Dark Energy Survey instead of dark sky flats) created residual sky patterns in DECam images. These patterns exist in all three optical bands (\(grz\)), with the \(z\hbox{-}\mathrm{band}\) having the worst residuals. So, starting with DR9, we correct DECaLS images to account for these residual sky patterns.
In addition, a new set of fringe templates was created for DECam \(z\hbox{-}\mathrm{band}\) images for DR9, with associated per-exposure fringe scale factors. For DR9, these fringe templates and scale factors replace the fringe correction applied by the Community Pipeline for DECam imaging in the \(z\hbox{-}\mathrm{band}\).
Tractor Catalogs
The Tractor code runs within the geometrical region of a brick to produce catalogs of extracted sources. This fitting is performed on the individual exposures that overlap the brick, without making use of image stacks (such as the image stacks detailed on the files page). This preserves the full information content of the data set in the fits, handles masked pixels without the need for uncertain interpolation techniques, and fits to data points without the complication of pixel covariances.
Morphological Classification
The Tractor fitting can allow any of the source properties or image calibration parameters (such as the PSF) to float. Only the source properties were allowed to float in DR9. These are continuous properties for the object centers, fluxes, and the shape parameters.
There is also the discrete choice of which model type to use. In DR9, six morphological types are used. Five of these are used in the Tractor fitting procedure: point sources, round exponential galaxies with a variable radius ("REX"), deVaucouleurs ("DEV") profiles (elliptical galaxies), exponential ("EXP") profiles (spiral galaxies), and Sersic ("SER") profiles. The sixth morphological type is "DUP," which is set for Gaia sources that are coincident with, and so have been fit by, an extended source. No optical flux is assigned to "DUP" sources, but they are retained to ensure that all Gaia sources appear in the catalogs even if Tractor preferred and fit a different source based on the deeper Legacy Surveys imaging. The total numbers of the different morphological types in DR9 are:
Primary Objects of Type |
All Northern Sources |
All Southern Sources |
Resolved Northern Sources |
Resolved Southern Sources |
Unique Sources |
|---|---|---|---|---|---|
All |
364,277,779 |
1,649,627,447 |
339,099,030 |
1,630,843,648 |
1,969,942,678 |
|
164,720,017 |
722,051,765 |
152,333,681 |
713,290,025 |
865,623,706 |
|
156,642,867 |
721,171,642 |
146,573,516 |
713,210,505 |
859,784,021 |
|
26,017,822 |
133,651,640 |
24,352,976 |
132,351,271 |
156,704,247 |
|
12,017,438 |
45,884,306 |
11,258,845 |
45,375,743 |
56,634,588 |
|
4,831,509 |
26,745,496 |
4,537,809 |
26,495,974 |
31,033,783 |
|
48,126 |
122,598 |
42,203 |
120,130 |
162,333 |
where northern sources are from BASS and MzLS, and southern sources are from DECam
surveys. Primary objects, here, specifically refers to sources for which BRICK_PRIMARY==True
(the totals are derived from the total number counts in the survey bricks summary file).
Sources are resolved as distinct by only counting BASS and MzLS sources if they are both at Declination > 32.375°
and north of the Galactic Plane, or, otherwise counting DECam sources. Unique sources are
the total of all resolved sources.
The decision to retain an object in the catalog and to re-classify it using models more complicated than a point source is made using the penalized changes to χ² in the image after subtracting the models for other sources. Here, the χ² value is calculated as a sum across all optical bands (i.e. \(g\), \(r\) and \(z\) for DR9). The "PSF" and "REX" models are computed for every source and the better of these two is used when deciding whether to keep the source. A source is retained if its penalized χ² is improved by 25; this corresponds to a χ² difference of 27 (because of the penalty of 2 for the source centroid). Sources below this threshold are removed.
The source is classified as the better of "point source (PSF)" or "round exponential galaxy (REX)" unless the penalized χ² is improved by 9 (i.e., approximately a 3σ improvement) by treating it as a deVaucouleurs or exponential profile. The classification becomes a Sersic profile if it is both a better fit to a single profile over the point source, and improves the penalized χ² by another 9. These choices implicitly mean that any extended source classifications have to be at least 5.8σ detections and that Sersic profiles must be at least 6.5σ detections.
The fluxes are not constrained to be positive-valued. This allows the fitting of very low signal-to-noise sources without introducing biases at the faint end. It also allows the stacking of fluxes at the catalog level.
Tractor Implementation Details
Tractor fundamentally treats the fitting as a χ² minimization problem. The current core routine uses the sparse least squares solver from the SciPy package, or the open source Ceres solver, originally developed by Google.
The galaxy profiles (the exponential and deVaucouleurs profiles mentioned above under Morphological Classification) are approximated with mixture-of-Gaussians (MoG) models and are convolved by the pixelized PSF models using a new Fourier-space method (Lang 2021). The galaxy profile approximation introduces errors in these models typically at the level of \(10^{-4}\) or smaller. The PSF models are treated as pixel-convolved quantities, and are evaluated at the integral pixel coordinates without integrating any functions over the pixels.
The Tractor algorithm could be run with both the source parameters and the calibration parameters allowed to float, at the cost of more compute time and the necessity to use much larger blobs because of the non-locality of the calibrations. A more practical approach would be to iterate between fitting source parameters in brick space, and fitting calibration parameters in exposure space.
Photometry
The flux calibration for BASS, MzLS and DECaLS are on the AB natural system of the 90Prime, Mosaic-3 and DECam instruments, respectively. An AB system reports the same flux in any band for a source whose spectrum is constant in units of erg/s/cm²/Hz. A source with a spectrum of \(f = 10^{-(48.6+22.5)/2.5}\) erg/s/cm²/Hz would be reported to have an integrated flux of 1 nanomaggie in any filter. The natural system implies that no color terms have been applied to any of the photometry, meaning that fluxes are reported as observed in the 90Prime, Mosaic-3 and DECam filter systems.
Zero point magnitudes for the Community Pipeline reductions of the 90Prime, Mosaic-3 and DECam images were computed by comparing Legacy Survey PSF photometry to Pan-STARRS1 (PS1) PSF photometry, where the latter was modified with color terms to place the PS1 photometry on the 90Prime, Mosaic-3 or DECam system. The same color terms are applied to all CCDs. Zero points are computed separately for each CCD, but not for each amplifier. The average color terms to convert from PS1 to 90Prime, Mosaic-3 and DECam were computed for stars in the color range \(0.4 < (g-i) < 2.7\) as follows:
Note that the DECam zero points have been significantly updated since DR5 and the 90Prime and Mosaic-3 zero points have been significantly updated since DR6. Functions to perform the conversions are available in the legacypipe code and the actual external PS1 catalogs we used are available at NERSC.
The brightnesses of objects are all stored as linear fluxes in units of nanomaggies. The conversion from linear fluxes to magnitudes is \(m = 22.5 - 2.5 \log_{10}(\mathrm{flux})\). These linear fluxes are well-defined even at the faint end, and the errors on the linear fluxes should be very close to a normal distribution. The fluxes can be negative for faint objects, and indeed we expect many such cases for the faintest objects.
The filter curves are available for BASS g-band, BASS r-band, MzLS z-band, MzLS z-band with corrections, DECaLS g-band, DECaLS r-band and DECaLS z-band. The curves "with corrections" include terms to correct for the telescope, corrector, camera and atmosphere.
Starting with DR6, PSF photometry uses the same PSF models (and sky background subtraction) for zeropoint-fitting as is later used in cataloging. So, for DR9, the measured fluxes for PS1 stars should be completely self-consistent.
The WISE Level 1 images and the unWISE image stacks are on a Vega system. We have converted these to an AB system using the recommended conversions by the WISE team. Namely, \(\mathrm{Flux}_{\mathrm{AB}} = \mathrm{Flux}_{\mathrm{Vega}} \times 10^{-(\Delta m/2.5)}\) where \(\Delta m\) = 2.699, 3.339, 5.174, and 6.620 mag in the W1, W2, W3 and W4 bands. For example, a WISE W1 image should be multiplied by \(10^{-2.699/2.5} = 0.083253\) to give units consistent with the Tractor catalogs. These conversion factors are recorded in the Tractor catalog headers ("WISEAB1", etc). The result is that the optical and WISE fluxes we provide should all be within a few percent of being on an AB system.
Galactic Extinction
The most recent values of the Galactic extinction coefficients are available on the catalogs page.
Astrometry
Starting with DR8, astrometry is tied entirely to Gaia Data Release 2. Each image is calibrated to Gaia Data Release 2, yielding an astrometric solution that is offset by the average difference between the position of Gaia stars at an epoch of 2015.0 and the epoch of the DR9 image. Source extraction is then fixed to the Gaia Data Release 2 system, such that positions of sources are tied to predicted Gaia positions at the epoch of the corresponding Legacy Surveys observation. Astrometric residuals are typically smaller than ±0.03″.
Astrometric calibration of all optical Legacy Surveys data is conducted using Gaia astrometric positions of stars matched to Pan-STARRS1 (PS1). The same matched objects are used for both astrometric and photometric calibration. The actual external PS1 and Gaia DR2 catalogs we used are available at NERSC.
Image Stacks
The image stacks (that are detailed on the files page) are provided for convenience, but were not used in the Tractor fits. These images overlap adjacent images by approximately 130 pixels in each direction. These are tangent projections centered at each brick center, North up, with dimensions of 3600 × 3600 and a scale of 0.262″/pix for the \(g,r,z\) data and 2.75″/pix for the WISE data. The image stacks are computed using Lanczos-3 interpolation. They have not been designed for "precision" work, although they should be sufficient for many use cases.
Depths
The histograms below depict the median 5σ point source (AB) depths for areas with different numbers of observations in the different regions of DR9:
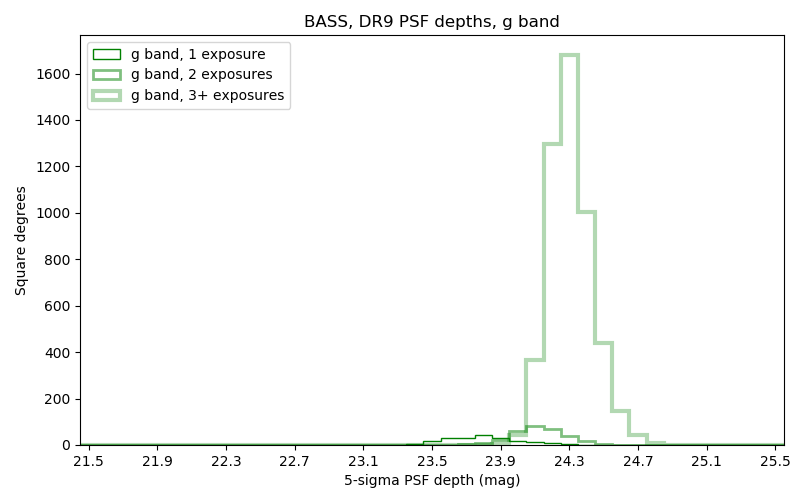
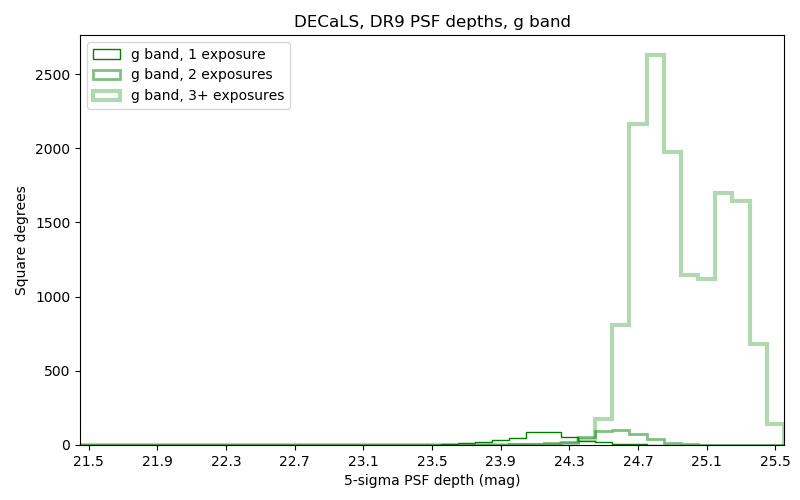
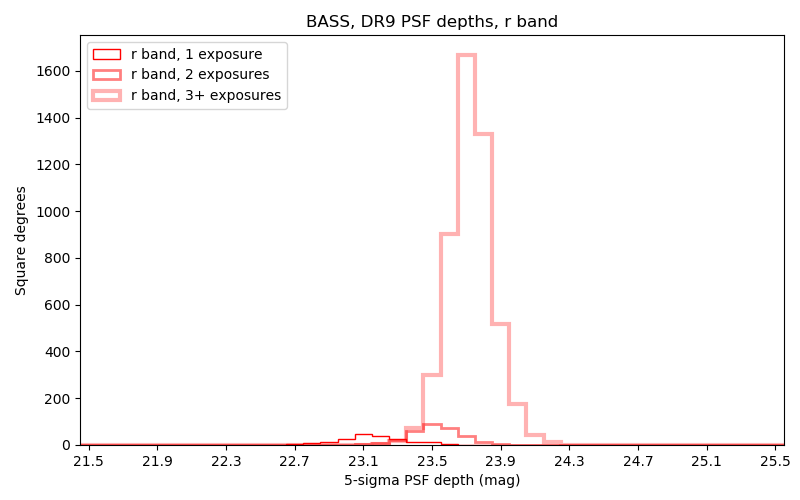
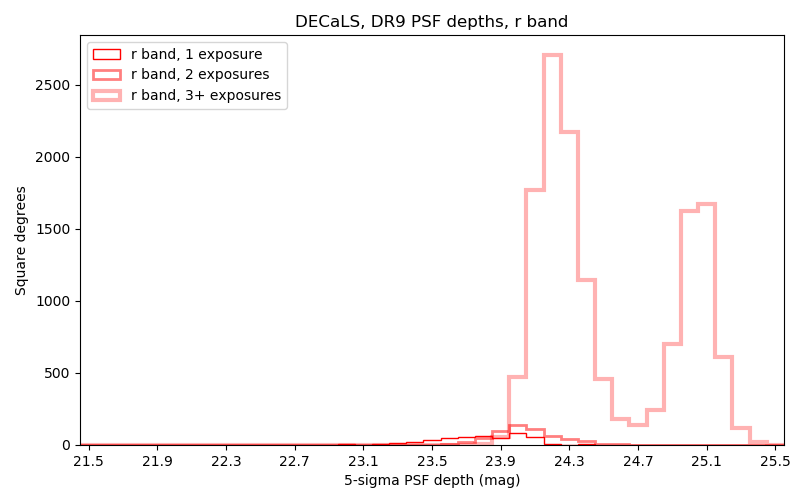
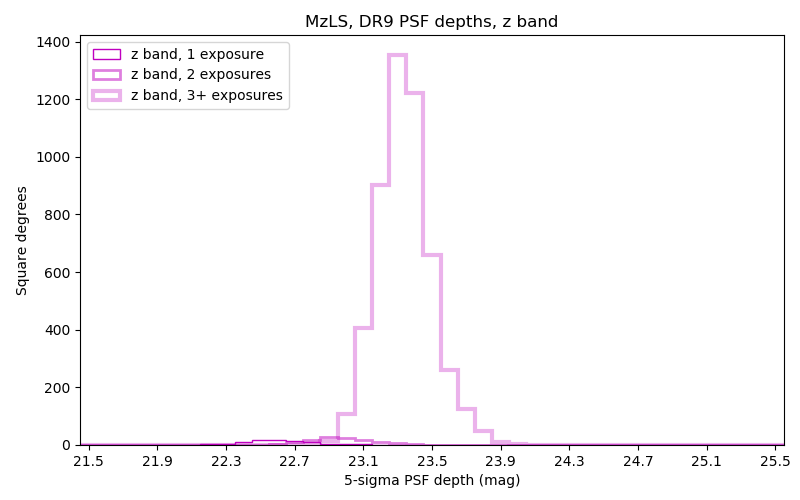
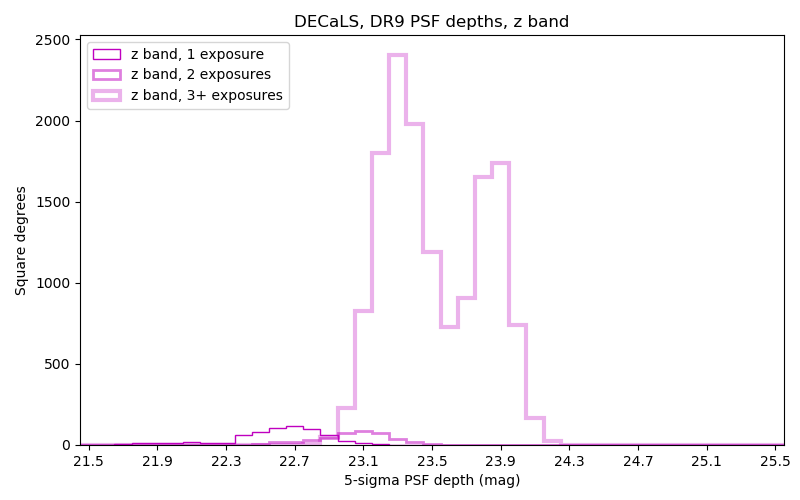
These are based upon the formal errors in the Tractor catalogs for point sources, and can be compared to the predicted proposed depths for 2 observations at 1.5″ seeing of \(g=24.7\), \(r=23.9\), \(z=23.0\).
Code Versions
LegacyPipe: A mix of versions; dr9-m33-1-g33038aa1, DR9.6.2, DR9.6.4, DR9.6.5, DR9.6.5-4-gbb698724 and DR9.6.7. The version used is documented in the Tractor header card
LEGPIPEV.Astrometry.net: 0.84
Tractor: dr9.5
NOIRLab Community Pipeline: A mixture of versions; recorded in the survey-ccds-* files as
plver.SourceExtractor: 2.25.2
PSFEx: 3.22.1
Glossary
- BASS
- Blob
-
Continguous region of pixels above a detection threshold and neighboring pixels; Tractor is optimized within blobs.
- Brick
-
A region bounded by lines of constant RA and DEC; reductions are performed within bricks of size approximately 0.25° × 0.25°.
- CP
-
Community Pipeline (reduction pipeline operated by NOIRLab).
- DECaLS
- DR3
- DR4
- DR5
- DR6
- DR7
- DR8
- DECam
-
Dark Energy Camera on the Blanco 4-meter telescope.
- maggie
-
Linear flux units, where an object with an AB magnitude of 0 has a flux of 1.0 maggie. A convenient unit is the nanomaggie: a flux of 1 nanomaggie corresponds to an AB magnitude of 22.5.
- MoG
-
Mixture-of-Gaussians to approximate galaxy models.
- MzLS
- NOIRLab
-
The NSF's National Optical-Infrared Astronomy Research Laboratory.
- nanomaggie
-
Linear flux units, where an object with an AB magnitude of 22.5 has a flux of \(1 \times 10^{-9}\) maggie or 1.0 nanomaggie.
- PSF
-
Point spread function.
- PSFEx
- SDSS
- SDSS DR12
- SDSS DR13
- SED
-
Spectral energy distribution.
- SGA
- SourceExtractor
- SFD98
- Tractor
- unWISE
-
New coadds of the WISE imaging, at original full resolution.
- WISE